This page introduces tests for comparing a normally distributed set of measurements with a hypothesized value (one-sample) and for comparing the means between two groups (two-sample test).
A one-sample t-test is a technique that we can use to test whether a population mean differs from some hypothesised value or standard.
If we want to test whether a population mean differs from some standard value, we often cannot use a Z-test because the population standard deviation is often unknown. Instead we need to use a one-sample t-test.
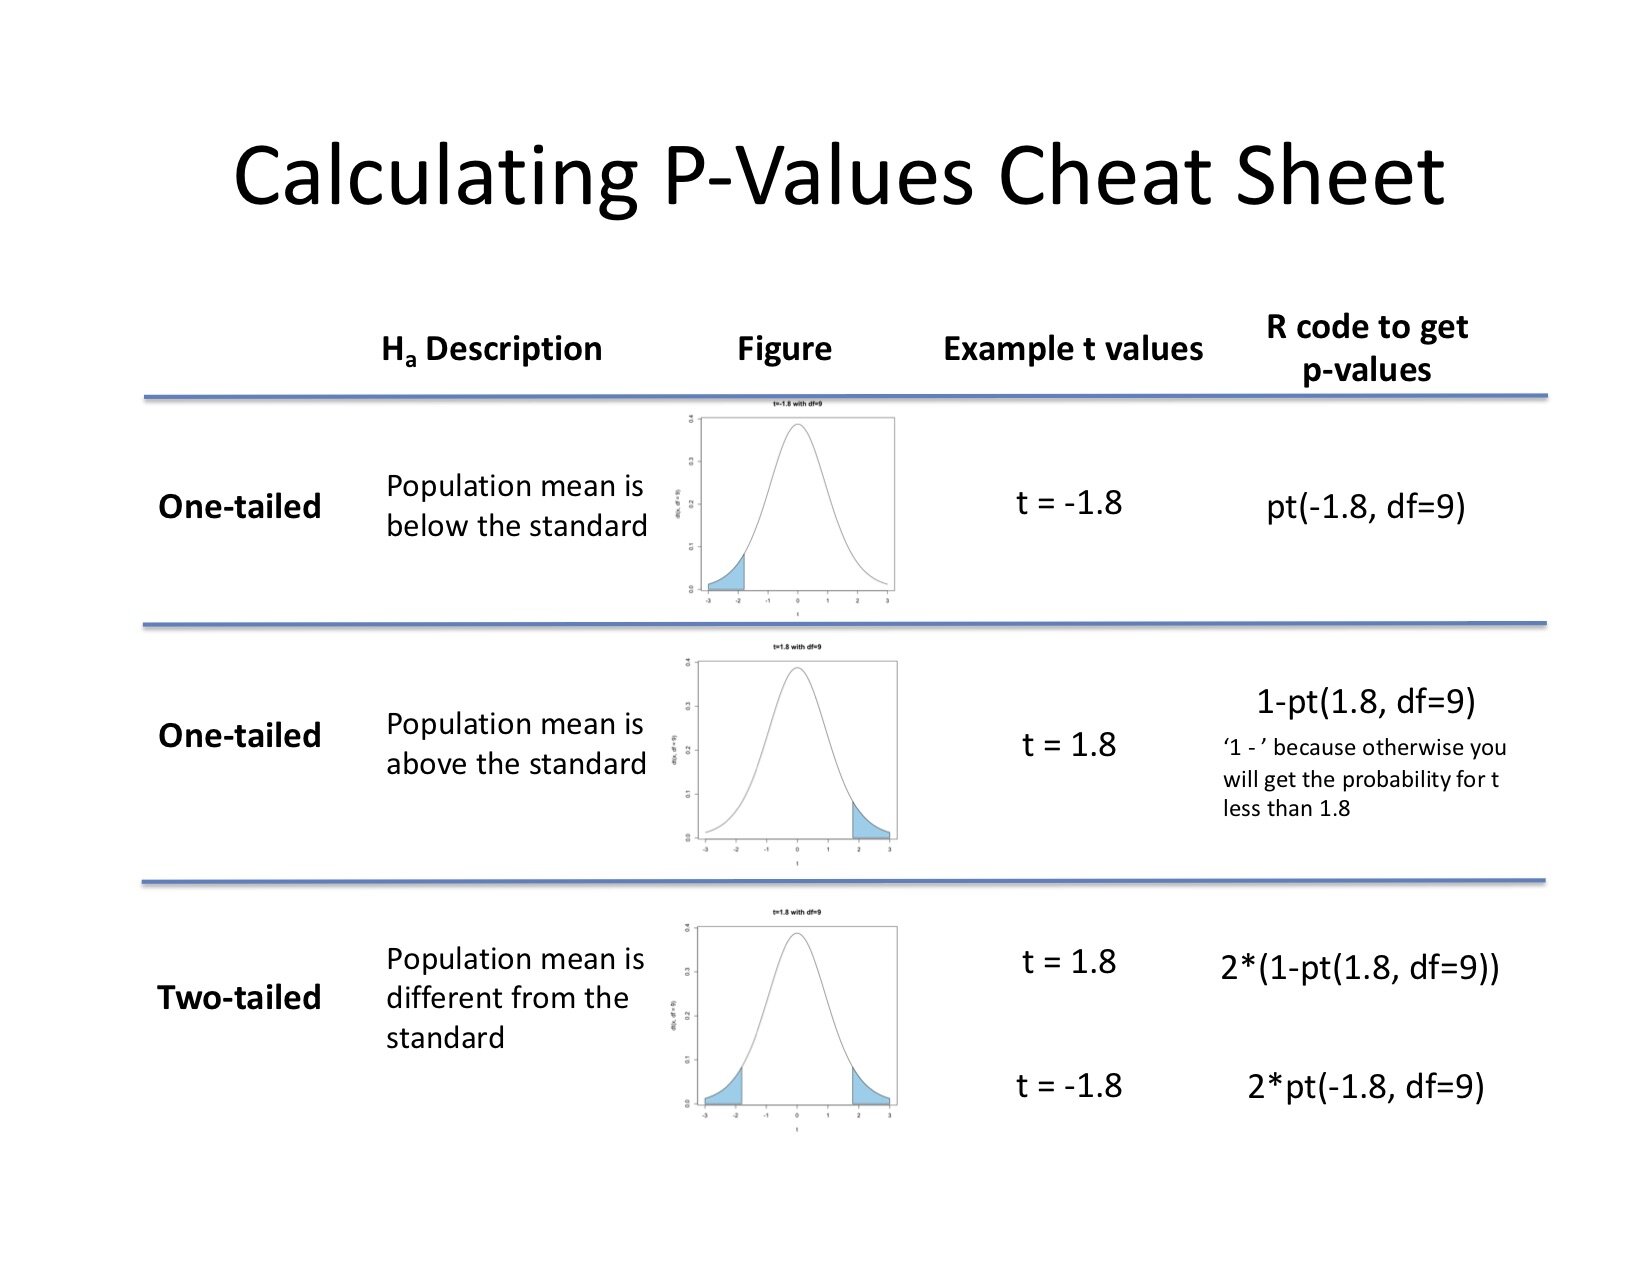
It can sometimes get confusing about what part of the distribution we need to consider for certain test statistics and certain tests. For example, when do we want to know the area to the left of the test statistic and when do we want to know the area to the right? The short answer is that it depends on whether our test statistic is positive or negative and what the alternate hypothesis is. It is not always the smaller area! Adding to some of the potential confusion is that R code such as ‘pt( )’ by default provides the area to the left of the test statistic provided.